Monday, December 18, 2017

Adaptation Measures: Beach Cleans

Hello all!

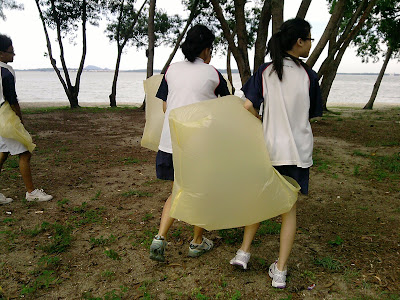
As mentioned, I will speak briefly about beach cleans this week. I recall myself going to mass beach cleaning activities in secondary school, having been instructed to pick up beach litter like bottles, plastic bags, food wrappers and drink cans before they were swept into the sea. However, it has struck me that large single-use garbage bags were used to store the beach litter as seen in Figure 14. 

Figure 14. Doing my part for the environment when I was 14 by cleaning up the shorelines of Singapore. Source: Author.

It personally brings to mind whether we will ever be able to completely eradicate plastic bag use, after developing such a form of dependence on it. I am personally still not able to avoid the use of single-use plastic bags for waste disposal at home, as they remain the cleanest and most efficient way to collect food waste and cooked liquids. How do we reuse and recycle these garbage bags? How do we make sure our mode of disposal ensures that they do not end up in water bodies?

In my next post after Christmas, I would conclude this blog. Have a great Christmas (and happy birthday to myself!)

Monday, December 11, 2017

Adaptation Measures: Legal Frameworks

Hello all!

In this post, I would be talking about how we may reduce negative externalities from plastic bags. Although there have been many abovementioned suggested measures, some technological measures have been well-discussed by a colleague (eg. Seabins, The Ocean Cleanup), and I would therefore choose to focus on the common measures - legal frameworks and beach cleanups.

Legal Frameworks

One agreement that has been particularly relevant for the control of plastic pollution is the London Convention 1972, later ratified as the London Protocol 1996. The former Convention aimed to control marine pollution by establishing a black-grey list approach to wastes, where items on the black list were prohibited from dumping and items on the grey list required a special permit before dumping could be carried out. The Protocol tightened the prevention of pollution even further by adopting a "reverse list", implying that all dumping is prohibited except otherwise indicated on the reverse list with a special permit. Incineration and export of waste products at sea were also disallowed. Both these frameworks indicate the prevention of dumping of plastics, and the ratification of the Protocol among states represent their move towards environmental consciousness. Extracted examples of these lists are seen in Table 4.

Table 4: Black-grey list of London Convention 1972, and reverse list of London Protocol 1996.
Legal Frameworks
Item lists
London Convention 1972
Black list
- Organohalogen compounds
- Mercury and mercury compunds
- Cadmium and cadmium compounds
- Persistent plastics and other persistent synthetic materials*
- Crude oil

Grey list
- Wastes containing matter such as arsenic, chromium, copper, lead (more in Annex II).
- Containers, scrap metal and bulky wastes

London Protocol 1996
Reverse list
- Sewage sludge
- Fish waste, or material from fish processing operations
- Vessels and platforms or other man-made structures at sea
- Dredged material
- Organic matter of natural origin
- Inert, inorganic geological material
- Carbon dioxide from capture processes for sequestration

There is great difficulty in obtaining dumping permits - (a) waste management audit to minimise the amount of waste to be dumped, (b) review all other modes of disposal including reuse and recycle before disposal, and (c) to consider for disposal on land before sea disposal, and these mean that sea dumping would be minimised. To ensure that parties comply with the protocol, it is essential for all parties to submit regular reports on dumping activities; unfortunately, the overwhelming efforts required mean that countries often opt out in favour of their continued convenience. Enforcement is also tough as curbing illegal dumping remains a challenge from the vast expanse of the unmonitored ocean waters.

On the bright side, I read a related article on a suggested local action plan for Singapore (where I come from) to reduce its marine trash and remedy its ugly shorelines following these global frameworks, arguably a nationalistic measure which may be more useful to encourage compliance within a country's own territorial waters.

In my next post, I will then talk briefly about beach cleanups. See you!

Monday, December 4, 2017

Mitigation Measures: Alternative Materials?

Hello all!

Two posts ago, I mentioned that a particular case study brought up "encouraging alternative bags" as a solution to forge greater environmental identity. In this post, I will discuss the problems of using alternative packaging materials based on research by the UK Environment Agency, which arguably displays an objectivity to adopt the best approach for the environment. Due to differing standards on the reference of LDPE and HDPE bags with the UNEP classifications, I will drop the abbreviations to avoid confusion and discuss them in terms of thickness, comparing between disposable thin bags and reusable thick bags.

Environmental Impacts of Different Carrier Bags (Source: UK Environmental Agency)

The study documented the environmental impact across its production, use and disposal. The bags considered were: a) conventional thin plastic bags, b) thicker plastic "Bags For Life", c) paper bags, d) non-woven polypropylene bags and e) cotton bags. There were five assumptions put in place in this study to derive the specific figures seen in Table 3:

1. Volume and weight of carrier bags were averaged across UK supermarkets.
2. Energy consumption was estimated by grid electricity.
3. Production waste from (a), (b) and (d) were taken to be recycled, waste from (e) was taken to be landfilled.
4. Transport distances were determined by industry experts, and were summed for the transportation of raw materials and the delivery of the finished bag to the site of retail.
5. IPCC 2007 characterisation factors determined the carbon footprint of each bag through its life cycle - summing resource use, production, transportation and end-of-life processes. A more detailed impact assessment using the CML2 Baseline method was used to calculate nine specific categorical environmental impacts, such as acidification and eutrophication.

Table 3: Characteristics and environmental burdens of each carrier bag, summarised and rounded off to 1 decimal place (Source: UK Environmental Agency).
Type of bag
Mass per bag (g)
Items per bag
Energy consumed per 1k bags (kWh)
Waste generation per 1k bags (g)
Typical total transport scenarios to UK
Carbon footprint per bag (kg CO2 eq)
End-of-life processes possible
Thin plastic bags
8.1
5.9
6.2
418.4
Lorry: 600km
Sea: 16000km
Rail: 270km
1.6
- Landfill
- Incinerate
- Mechanical recycling
Thick plastic bags
34.9
8
6.4
171.2
Lorry: 700km
Sea: 21000km
Rail: 560km
6.9
- Landfill
- Incinerate
- Mechanical recycling
Paper bags
55.2
7.4
-
-
Lorry: 1200km
5.5
- Landfill
- Incinerate
- Mechanical recycling
- Compost
Non-woven PP bags
115.8
7.3
-
5850
Lorry: 600km
Sea: 15000km
Rail: 280km
21.5
- Landfill
- Incinerate
- Mechanical recycling
Cotton Bags
183.1
10.6
11
1800
Lorry: 680km
Sea: 15000km
271.5
- Landfill
- Incinerate

As seen in Table 3, the thin plastic bags have shown to demonstrate the lowest carbon footprint and the lowest environmental impacts in 8 out of 9 categories not displayed here; cotton bags, on the other hand, showed shockingly large environmental burdens. In  the consideration of every step of this life cycle in the production of one bag, it creates a carbon footprint much greater than the other carrier bags: (a) Process of growing cotton requires large land areas, year-round irrigation, and application of fertilisers and pesticides for soil cultivation, leading to large abiotic resource depletion, (b) Transportation to cotton mills with other required raw materials drove vehicle pollution, as well as the final transportation to consumers, and (c) Conversion of cotton into cotton yarn consumes large amounts of energy and water.

Assuming that 40.3% of thin plastic bags were reused as bin liners (a figure averaged across all respondents), reusable thick plastic bags, paper bags, PP bags and cotton bags had to be reused 5, 4, 14 and 173 times respectively to bring their carbon footprints below that of thin plastic bags.  These figures unfortunately greatly challenge the flow of this blog thus far by showing that alternative packaging materials may help plastic pollution, but probably not the Earth overall - arguably, there may be issues more pressing than the current concerns about aquatic biodiversity, showing greater complexity of the issues around plastic pollution. It is obvious that bags intended to last longer should use a greater amount of resources and therefore in its production cause greater environmental impacts - however, is this (exceedingly large) amplification of environmental impact justifiable?

I hereby adopt the view that our actions should be in taken for the best interests of our Earth, rather than the sole issue of plastic pollution. My purpose is not to drive pessimism, neither is it to continue encouraging single-use thin plastic bags, but to highlight that the key to reducing the overall environmental impact from packaging is to reduce our uses of plastic bags, and to reuse them for secondary applications as much as possible. Reduce, reuse, recycle. In my next post, I will be talking about the other branch of legislations: adaptation measures when plastics have already found their way into the Earth system.

See you!
Monday, November 27, 2017

Trivia: It's Black Friday!

Hello all,

Before I move on to talk more about legislations, it would be highly seasonal and appropriate to talk about Black Friday as the weekend sales come to an end with Cyber Monday.

Black Friday

Figure 13: The tweet that nicely summarises this post (Source: @squeezyjohn on Twitter)

Plastic toys and large electronic goods are among the most popular items promoted during Black Friday, and in their manufacturing process large amounts of plastic have been used. The largest problem lies in the excessive and wasteful behaviour that Black Friday encourages amid the rush to get items at a marked-down rate. These reduced prices are often compensated by the price paid by our oceans, forests and wildlife as the plastic that feeds our shopping habits becomes waste within a year or less, eventually contributing to our plastic ocean as succinctly stated in Figure 13. 

No amount of recycling or incineration may ever stop the harmful effects from such excessive consumerism. Therefore, do we really need these plastic products? Does that need justify the environmental damage, mainly plastic pollution and vehicle air pollution in transportation? Using these thought processes, we would be doing much more with less.

Monday, November 20, 2017

Mitigation Measures: ↓ Supply and Demand

Hello all!

Following up from the list of legislations I collated (recall: Table 1), I will elaborate about the mitigation measures over two blog entries and my personal thoughts.

↓ Supply

Mitigation measures such as taxing suppliers and prohibition of plastic manufacture and distribution aim to target plastic waste at the forefront of its life cycle, where manufacturers respond by reducing supplies when the quantity demanded by consumers fall. Examples include the Recycled Plastics Rules implemented by India in 1999 and the SB 270 implemented in the States where grocery stores and pharmacies were banned from distributing single-use carrier bags (defined as <40μm). Environmental groups backed these moves, although they sparked outrage from manufacturers arguing against it for weak reasons such as: a) jeopardise thousands of manufacturing jobs, b) does not help the environment, and c) line the pockets of grocery shareholders. 

I would refute opinions (a) and (c). Recyclable and reusable bag production create an alternative packaging market, fulfilling a positive brand image at the same time by exercising CSR as a strategic move. They are even provided with assistance in transition to greener production methods. Although the higher cost of recyclable bag production has controversially allowed large grocery stores (eg. Sainsbury) to cut costs by reducing their share to charity, I am in support. The stoppage in distribution of single-use carrier bags, the replacement with thicker 'Bags For Life', and one-for-one exchanges when the bags wear out - these create economic incentives for consumers to use and reuse their plastic bags, changing consumer behaviours with regard to thinner plastic bags over time. In my opinion, they are way ahead in this battle against plastic bags, compared to other stores that continue to charge for thin brittle plastic bags and justify it by donating the proceeds to charity.

For opinion (b), the manufacturers argued that the legislations were passed to affect them undesirably under "the guise of environmental stewardship". I argue that these bans were actually politically difficult to make for its unpopularity to businesses, as they affect not just the plastic bag industry but the entire retail scene by increasing their costs.

↓ Demand

A reduction in demand works through consumers, where they decrease their use of plastic through motivations such as saving money by avoiding the plastic bag charge. Using a case study from Portugal, a plastic bag tax saw a 74% decrease in number of used plastic bags and extensions on the life of reusable plastic bags for up to 2 months. There was a trade-off however, as there was a 12% increase in the purchase of garbage bags - overall, this is still likely to be in favour of the charge, as economic disincentives by a cost on garbage bags will control the purchase of plastic bags by consumers.

On many occasions, it is likely that a coupling of these approaches take place; there have been qualitative studies in Portugal where the implementation of the plastic bag tax has been cited to increase awareness of environmental problems related to plastic bags. It was also mentioned that there is room for improvement in forging a greater environmental identity by encouraging alternative bags, although I am ambivalent about this statement at present. I will explain why in the next post.

See you!

Monday, November 13, 2017

List of Legislations

Hello all!

If you recall, my first entry was inspired by a legislation implemented back at home that was not well-received by some. Since then, I have come across recommendations by several authors for the reduction of plastic waste and I have collated them in this post, categorised by the familiar terms of mitigation measures (see Table 1) and adaptation measures after plastic has emerged within the Earth system (see Table 2).

Table 1: Mitigation measures through reducing supply or demand of plastics.
Mitigation Measures
Methods
Description/Example
↓ Supply
- Ban single-use carrier plastic bag production.
- Ban the use of plastic containers.
- Charge tax on manufacturers.
↓ Demand
- Decrease usage by consumers.
- Paper bags and cotton bags to replace plastic bags.
- Non-plastic exfoliating substances to replace microbeads.
- Increase life of plastic by enhancing reusability and durability (circular plastic economy), reducing overall demand.
- Discourage use of plastic consumption.

Reduction of negative externalities in adaptation measures can come in the form of preventing their output into coastlines, oceans and sewage systems, or by extending the social benefits from plastic bags.

Table 2: Adaptation measures through reducing negative externalities arising from plastic bags.
Adaptation Measures
Methods
Description/Example
↓ -ve externalities
- UNCLOS 1982
- International Convention for Preventation of Pollution from Ships (MARPOL)
- Convention on Prevention of Marine Pollution by Dumping of Wastes and Other Matter (London Convention) 1972
- Volunteer beach cleans.

Technology to clean up water bodies
- The Ocean Cleanup (12)
- Seabins (blog post by fellow colleague)
- Remora.
Technology to prevent discharge of plastics

- Guppy Friend preventing microplastic fragments from fleece

- Increase social benefits, but done in conjunction with development of C capture and storage to balance trade-off with greenhouse gas emissions.

As with climate change, both types of approaches are needed. I will conclude this entry here after several weeks of relatively longer posts, and I will elaborate on these legislations and their usefulness as mentioned previously in the following weeks.

See you next week!

Monday, November 6, 2017

Impacts: Microfibre, the less known evil

Hello all!

I have spoken extensively about microplastics in my previous post, and how they may potentially impact human health. However, plastic bags and their fragmentation are only secondary sources of microplastics. Microplastics in the oceans may result directly from primary sources, and the major sources include our familiar microplastic-sized fibre from textiles and microbeads from cosmetics.

Microfibre

Microplastic contamination along the South African beach coastlines has been cited to hail largely (80-90%) from the synthetic plastic fibres that are released during a machine wash cycle. These small plastic fibres are able to pass through preliminary sewage treatment screens (>1.5mm) and are not readily decomposed by bacteria, Eventually, they end up in aquatic environments where they form a substantial volume of microplastic pollution. Based on the results seen in Figure 11, a washing load of polyester-cotton blend, polyester and acrylic clothing release 140k, 500k and 730k of fibre respectively when rounded off to the nearest 2 significant figures. 

Figure 11. Diagram to show the original garments, their typical fibres, the mean fibre dimensions and estimated fibre released per wash cycle (assume a wash load of 6kg).

In another study done by popular apparel company Patagonia in partnership with academics, it was found that an average of 1.2g of microfibers are released from the washing machine when synthetic fleece jackets are washed. Up to 40% of these microfibres make their way into water bodies, depending on the quality of the local sewage treatment. By estimating the volume of plastic microfibre in sewage effluents, it was estimated that the sewage affluents of a population of 100k people would produce approximately 1kg of fibres a day, with more of this produced during winter due to greater washing machine usage (700% greater) from the usage of more clothes.

Microbeads

In the last few years, there has been increasing potential for microplastic pollution through the use of cosmetic products. Microplastics have increasing replaced natural exfoliating materials, such as oatmeal or apricot husk, in facial cleansers, toothpastes and shower gels (see Figure 12). They are often being marketed to consumers in forms such as "micro-beads", "microbead formula" or "micro exfoliates". These plastic microbeads are mostly made of PE (93%), are present in sizes at most up to 1mm, and after usage they similarly travel through wastewater systems for their eventual discharge into oceans due to the inability to degrade naturally.

Figure 12. Exfoliating scrubs in the market (picture source). Find them familiar? Me too.

The average consumer now has a microplastic-containing product in their home and uses it at least on a weekly basis. A case study based in Europe estimated that 680 tonnes of microplastic beads are used and disposed of by the United Kingdom, regionally 4130 tonnes are used in EU countries plus Norway and Switzerland. In the worst case scenario, the relative contributions of microplastic beads to marine litter may constitute up to 11%, although the contribution to the North Sea environment from cosmetic products in 2012 was likely between only 0.1-1.5%.

Thoughts

Microplastic pollution is on a worsening trajectory, as the increases in human population encourage a greater use of cosmetic products and an increase in synthetic textile production. Textile washings are important as part of daily domestic activities, regardless of social and cultural backgrounds; the application of facial scrub exfoliants is also estimated to be used by around 1.1 million women in the UK with daily application. Our plastic behaviour has been very much normalised, with our lifestyle habits damaging the oceans in ways we do not know.

Overall, I have covered the bulk of land-based sources which make up of 80% of plastic debris in the marine environment, namely beach litter (eg. plastic bags), material discarded in landfills, textile fibres from washings and synthetic components of personal care products. Notably, microplastics are extremely difficult to remove from water bodies due to their small size and ubiquitousness. Therefore, the best way to reduce plastic pollution is to minimise it at its source, and after reading week I will broadly cover the legislations and alternatives to plastic waste and packaging.

See you next week!

Monday, October 30, 2017

Impacts: Microplastics, the silent killer

Hello all!

In a follow up from my previous post, I will elaborate more on microplastic debris pollution in the marine environment, which accumulate in organisms over time without directly causing death.

Microplastics: the silent killer


Microplastics and their effects are critical to understanding the magnitude of impact on marine life.  As plastics do not decompose readily, they accumulate in the environment over a long period of time and concentrate toxic pollutants. Pollutants include additives used in the plastic compounding process during the manufacturing processtoxicity from intermediates in the degradation of plastic (eg. styrene) and the persistent organic pollutants (POPs) in seawater that may be absorbed into the microplastic fragments. These are ingested by aquatic organisms, with the impacts briefly listed below:

1. Reduced health and ecological function of the individual: exposure of microplastic fragments to zooplanktons such as copepods and bivalve larvae has shown to cause reduced algal ingestion rates in the example of the copepod Centropages typicus.
2. Increased mortality rates: prolonged exposure to microplastics has also been observed to lead to increased mortality rates in the copepod Tigriopus japonicus over successive generations.
3. Catastrophic ecological transfers: POPs within microplastics and their impacts may be transferred across trophic levels within the food chain, observed within the planktonic food web between copepods and mysid shrimps.

Nonetheless, there are still challenges as the impacts of microplastics are still fairly inconclusive at this stage. Adverse effects of plastic transfer and potential bioaccumulation in organisms are still fiercely debated at present as they have only been observed under extreme laboratory conditions in the abovementioned studies; current technology does not allow for the quantification and measurement of nanoplastics in organisms, and therefore there are uncertain effects on human health. In the best estimate on impacts of human health, it was also studied to be negligible, as the majority of microplastics are found in digestive tracts of marine animals, which are often disposed of before human consumption. Even in consumption of bivalves in whole (eg. mussels), a worst case estimate of exposure to microplastics would be 7 µg, considered a negligible amount relative to the total dietary intake of persistant, bioaccumulative and toxic substances (PBTs) by humans.

Summary

Macroplastics and their immediate impacts on marine organisms (recall: "serial killer") are clear disruptions to the natural ecological balance, and an obvious telltale sign that our plastic consumption inflicts direct harm on the environment. Microplastics and their impacts are much less conspicuous, as they have only been evident under extreme laboratory conditions which do not represent the fatigue of the oceans. Unfortunately, the present lack of direct health risk from ingesting minute quantities of microplastics or nanoplastics as written above also serves little to discourage individuals from irresponsible use of plastics.

Nevertheless, it is important to consider the projected increase of plastic waste in the future (recall: introduction post), which may concomitantly possibly magnify the presently undetected impacts of plastic consumption in humans through the 7-step causal chain I constructed in Figure 10.  The micro-nanoplastic problem is especially important given that the particle distribution will increasingly shift towards microplastics and nanoplastics in aquatic environments with fragmentation over time.

Figure 10. Flowchart representing the causal chain of increased plastic waste in the environment, with accompanying ecological effects on aquatic organisms and impacts on human health highlighted in red (Source: Author).

The causal chain drafted above also serves as an effective summary for our discussion in this week's entry. In my following post, I will talk more about the impacts of microplastics from microfibre and microbeads, something I came across in social media lately.

See you!

Monday, October 23, 2017

Impacts: Macroplastics, the serial killer

Hello all!

Last week, I spoke briefly about microplastics from the degradation of plastic bags, which may be a less familiar concept compared to macroplastics. I coined the headers 'serial killer' and 'silent killer' as catchphrases, which succinctly summarise the impacts of both macroplastics and microplastics on aquatic organisms respectively.

Macroplastics: the serial killer

Macroplastics in the form of mesoplastics (>5mm in size) and macroplastics (>25mm in size)kill millions of marine animals every year. Impacts are briefly listed below:

1. Death from entanglement: entanglement may lead to debilitation and subsequently starvation; ingestion by marine species also cause these animals to face a reduced quality of life and lowered reproductive performanceOther taxa that have been affected similarly include penguins, dolphins, and fur seals (see Figure 7).
2. Death from consumption: sea turtles mistake plastic bags for jellyfish (see Figure 8), a situation which obstructs the passage of food, possibly leading to death from starvation. Sea turtles are extremely vulnerable due to their inability to regurgitate their food intake from the downward-facing spines in their throat.
3. Ecological implications (ripple effect): sea turtles naturally keep the jellyfish population in check, and a reduction of sea turtles in the ocean may indirectly promote the jellyfish population, which feeds on fish larvae and therefore reduce fish populations in the ocean.
4. Facilitate spread of pathogens: due to the durability and floatibility of plastic, microorganisms may hitchhike and accumulate on plastic up to years, introducting pathogens into marine ecosystems observed in the coral reefs and introducting non-native species (eg. algal blooms) across marine environments.
5. Economic lossespiles of macroplastic waste that may make their way onto shorelines are visually appalling to the observer, and has been studied to lead to reduced tourism from negative emotions as they devalue the experience of beachgoers (see Figure 9). They also lead to decreases in income from recreational tourism due to its interference with the shipping and fishing industries.
6. Choke urban drainage systems: plastic bags were the culprits to choking urban drainage systems, causing devastating floods in Bangladesh in 2002. Bangladesh thereafter became the first country in the world to legislate a ban on thinner plastic bags, although the country continues to struggle with enforcing the ban.

Figure 7. Seal entangled by plastic, which may potentially lead to death. Photo: LiveScience (2017)

Figure 8. Animation (click to open in a separate window if it does not load) of a sea turtle unable to differentiate between jellyfish and plastic bags. Source: Conserve Turtles (2017)

Figure 9. Freedom Island, an artificial island in Manila Bay, Philippines, showing clearly the impact of plastic waste in our oceans that have washed up onto shorelines. Photo: Dianna Cohen, Plastic Pollution Coalition (2017)

In this post, I have spoken about the visually appalling effects from imcroplastics. In the following week, I will speak more about microplastics with their unseen ecological impacts, before summing up these two entries with my thoughts.

Tuesday, October 17, 2017

Introduction: Life Cycle of Plastic Bags

Hello all!

In my second week on plastic waste, I would first summarise the life cycle of plastic bags from its construction, using an improvised and basic flowchart seen in Figure 5.

Life Cycle of Plastic

Figure 5. Life Cycle of Plastics (Improvised from sources: 1, 2)

Plastics are very widely used in products and production processes, such as in the form of packaging, textiles, in automotive parts, and paints. They are formed from long chains of organic polymeric molecules, with the most widely-used synthetic polymer being polyethylene (PE). Generally, polyethylene bags are made using plastic pellets which are subjected to high pressure, melted in a hopper, and extracted through a vertical tube to form a long continuous plastic film of desired thickness. Individual bags are then created by cutting and heat-sealing the bags.

Within PE, there are three types of molecules used for plastic bags: linear low-density polyethylene (LLDPE), low-density polyethylene (LDPE) and high-density polyethylene (HDPE). Generally, the higher the density, the greater the molecular weight and the stronger the resulting plastic bag. These three uses account for a combined 38% of global plastic production.

Figure 6. Different types of plastics and their uses (Source: UNEP on Twitter)

Figure 6 shows the different PE types and their typical uses in plastic bagging. Although the image may indicate that LDPE forms the bulk of marine plastic litter given their lightweight properties, over the course of my research I conclude that thickness of the bags in consideration of impacts - the thinner the plastic bag, the lower its quality and the lower its re-usability. Subsequently, some of these lightweight plastic bags may make their way to water bodies from land-based sources such as beach litter and their buoyancy encourages ocean-driven surface transport. Over time, the plastic waste undergoes fragmentation when subject to UV-radiation and warm temperatures as they traverse the oceans, and may form microplastics (defined as plastic particles <5mm in size) which can stay in the ocean for thousands of years.

This knowledge would later be helpful in assisting our understanding on the adverse effects (ecological, environmental and social costs) of marine plastic litter in our oceans. See you!

Monday, October 9, 2017

Introduction: Why Plastic Waste?

Hello all!

Having enrolled in the 'Global Environmental Change' module, I have chosen to zoom in the pertinent issue of plastic waste. Plastic pollution has increasingly received attention, owing to the growing accumulation of plastic waste that has materialised in the Great Pacific garbage patch. Based on the current consumption of plastic, plastic waste has been anticipated to increase by 10 times by 2025. Regionally, 8% of the manufactured plastic bags in the European Union are littered to the ocean, forming the bulk of marine litter.

Personal Thoughts

In my journey of blogging, although I will examine plastic waste and its impacts on the environment as a whole, I will focus disproportionately on plastic bags. This choice originates from the recent summer spent back home in Singapore, where I realised that consumer habits when it came to plastic bagging differed very much. I arrived in London the first time a mere 2 weeks before the '5p Plastic Bag Charge' was implemented on all single-use plastic carrier bags in large shops, which had me reducing my plastic bag use drastically. Incidentally, supermarkets in Singapore were in discussion to implement a similar move come 2018, to reduce the burden of plastic waste disposal on our only landfill. The news came as a pleasant surprise for me, especially as I had gotten used to living with less plastic in London.

Figure 1. Article on Singapore's highest-selling paper, The Straits Times, on the plans of implementing a plastic bag charge. But it certainly did trigger some angry reactions, as seen in the following 3 figures.

Figure 2. Angry netizen #1.

Figure 3. Angry netizen #2.

Figure 4. Angry netizen #3.

In my opinion, single-use carrier bags are commodities we could do with less - we could pay for one  reusable plastic bag, use free handmade tote bags, or even our school bags to store groceries. The only inconvenience is travelling around with a reusable bag, and unfortunately this inconvenience could outweigh our care for the environment, possibly due to an unawareness of the full impact on the Earth from plastic waste as seen from Figures 2, 3 and 4. These opinions made me realise that before implementation of industry-wide moves, it is first quintessential to encourage responsibility and care for the environment. In the following weeks, I will explore these thematic areas:

1. Life cycle of a plastic bag from its construction to its destruction.
2. Environmental, ecological and social costs of plastic waste (especially plastic bags).
3. Legislations around plastic bags and how to tighten these regulations.
4. Proposed alternatives: biodegradable plastics, paper bags, and recyclable bags.
*5. How will I respond to these Facebook comments?

I hope that my blog would positively reshape mindsets around plastic packaging to move towards a cleaner Earth. See you next week!